How to measure customer sentiment (a practical 2026 guide)

Riellvriany Indriawan

Katelin Teen
Last edited July 6, 2026

What customer sentiment actually is (and what it isn't)
I work the support queue most days, and the thing I've learned is that a satisfaction score and a customer's actual mood are two different animals. People conflate them constantly.
Here's the clean split. Satisfaction is a measured score on a scale you defined. You asked a question, they picked a number, you did the math. Sentiment is the feeling underneath the words, whether or not anyone asked. IBM defines sentiment analysis as "the process of analyzing large volumes of text to determine whether it expresses a positive sentiment, a negative sentiment or a neutral sentiment." The key phrase is large volumes of text, because sentiment doesn't wait for a survey. It's already sitting in your inbox.
That distinction matters because Bain, the firm that invented NPS, admits the whole reason they built a new metric was that "conventional customer satisfaction surveys often don't work... because the results aren't directly linked to financial outcomes or customer behaviors" (Bain & Company). So a score alone is a thin signal. Measuring sentiment properly means reading both the number and the language behind it.
The three metrics everyone starts with: CSAT, NPS, CES
If you're measuring sentiment at all, you're probably starting with a survey, and there are three that dominate. They aren't interchangeable, and picking the wrong one for the question you're asking is the first mistake teams make.
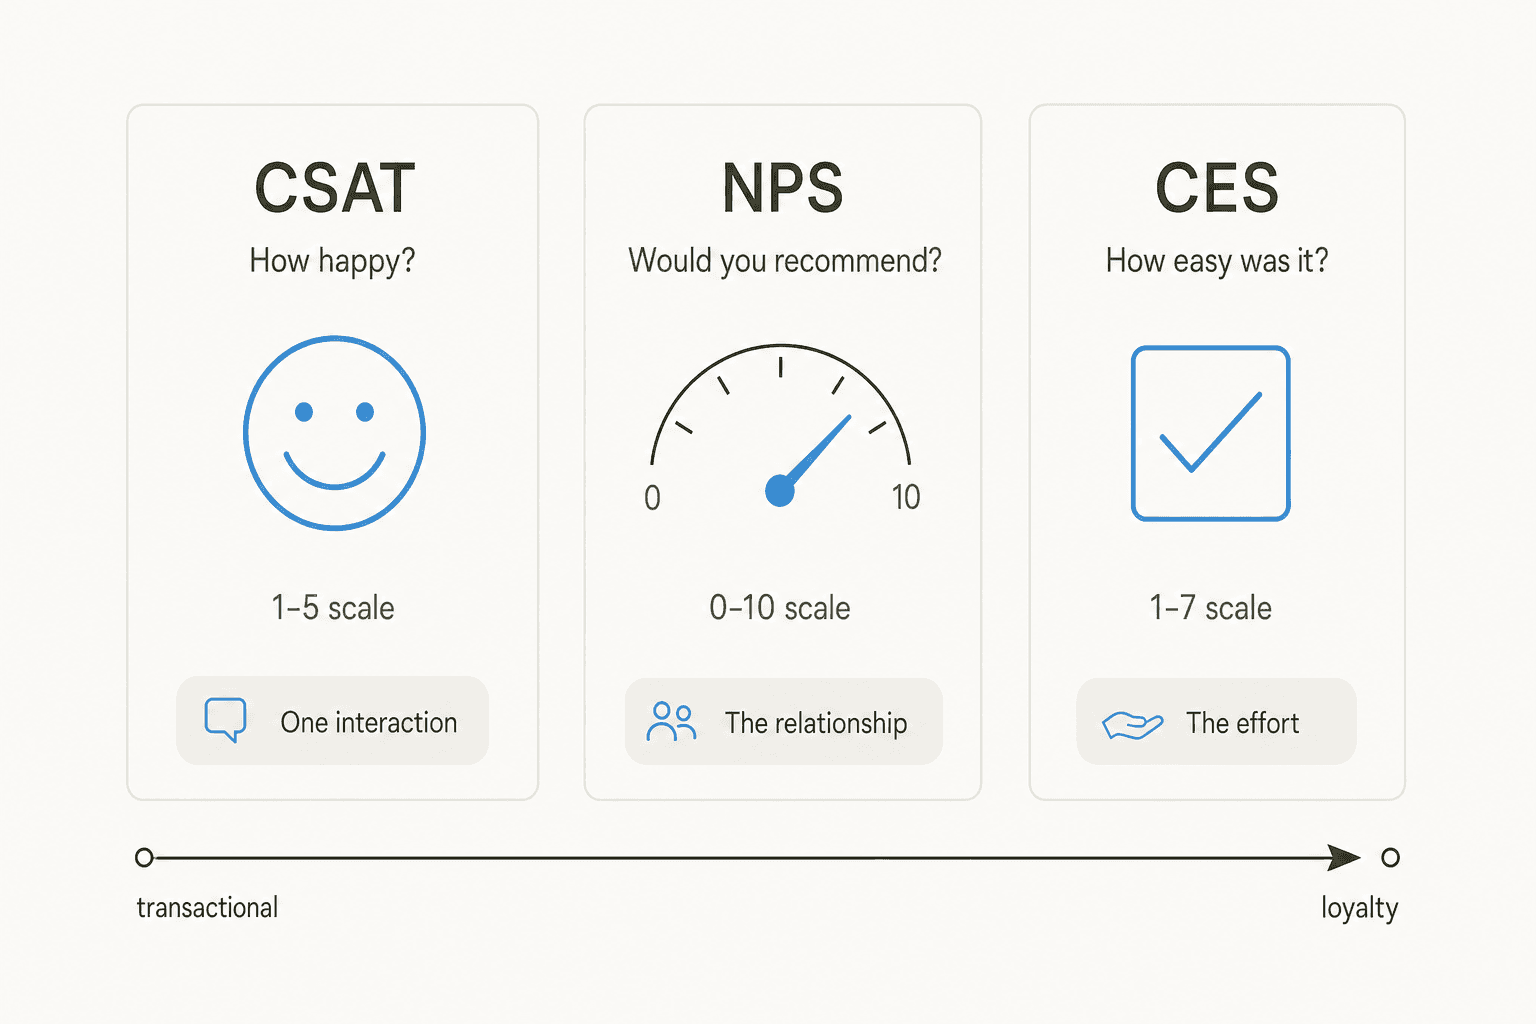
Here's how they actually differ:
| Metric | The question | Scale | What it captures | Formula |
|---|---|---|---|---|
| CSAT | "How satisfied were you?" | 1-5 (most common) | Happiness with one specific interaction | (satisfied responses / total) × 100 |
| NPS | "How likely are you to recommend us?" | 0-10 | The overall relationship and loyalty | % promoters − % detractors |
| CES | "The company made it easy to handle my issue" | 1-7 | How much effort the customer had to spend | sum of responses / number of responses |
A few things worth knowing about each:
CSAT is your transactional snapshot. The standard formula counts your top-box answers (usually 4s and 5s on a 5-point scale) as a percentage of all responses, so 80 happy answers out of 100 is a CSAT of 80% (IBM). It's great right after a ticket closes and useless for measuring the whole relationship. If you want the deep version, we wrote a full guide on AI and CSAT, plus a breakdown of Zendesk satisfaction metrics if that's your stack.
NPS is the relationship metric. Fred Reichheld introduced it in his 2003 HBR article "The One Number You Need to Grow," and the math is simple: promoters (scored 9-10) minus detractors (0-6), with passives (7-8) left out, giving a range of −100 to +100. Bain notes that promoters "account for more than 80% of referrals in most businesses," which is why the number tracks growth. But Bain is blunt that the score is meaningless without the open-text "why": "Asking a customer to tell us in their own words why they gave a score is what helps us understand how we can take action." That free-text field is the bridge from a metric to real sentiment.
CES measures effort, and it's the one most support teams underuse. It came out of CEB's (now Gartner) 2010 HBR article "Stop Trying to Delight Your Customers," and the finding behind it is stark: 96% of customers who have a high-effort service interaction become more disloyal, versus just 9% who have a low-effort one (Qualtrics). If your reader keeps getting transferred, repeating their order number, or switching channels, that's the effort tax showing up. Reducing it is exactly what good ticket triage and ticket summarization are for.
My honest take: pick one of these as your headline trend metric so you're not drowning in survey fatigue, then spend your real energy on the layer below.
Why surveys alone will lie to you
Here's the uncomfortable part. Every survey metric shares the same blind spot: it only measures the people who answered.
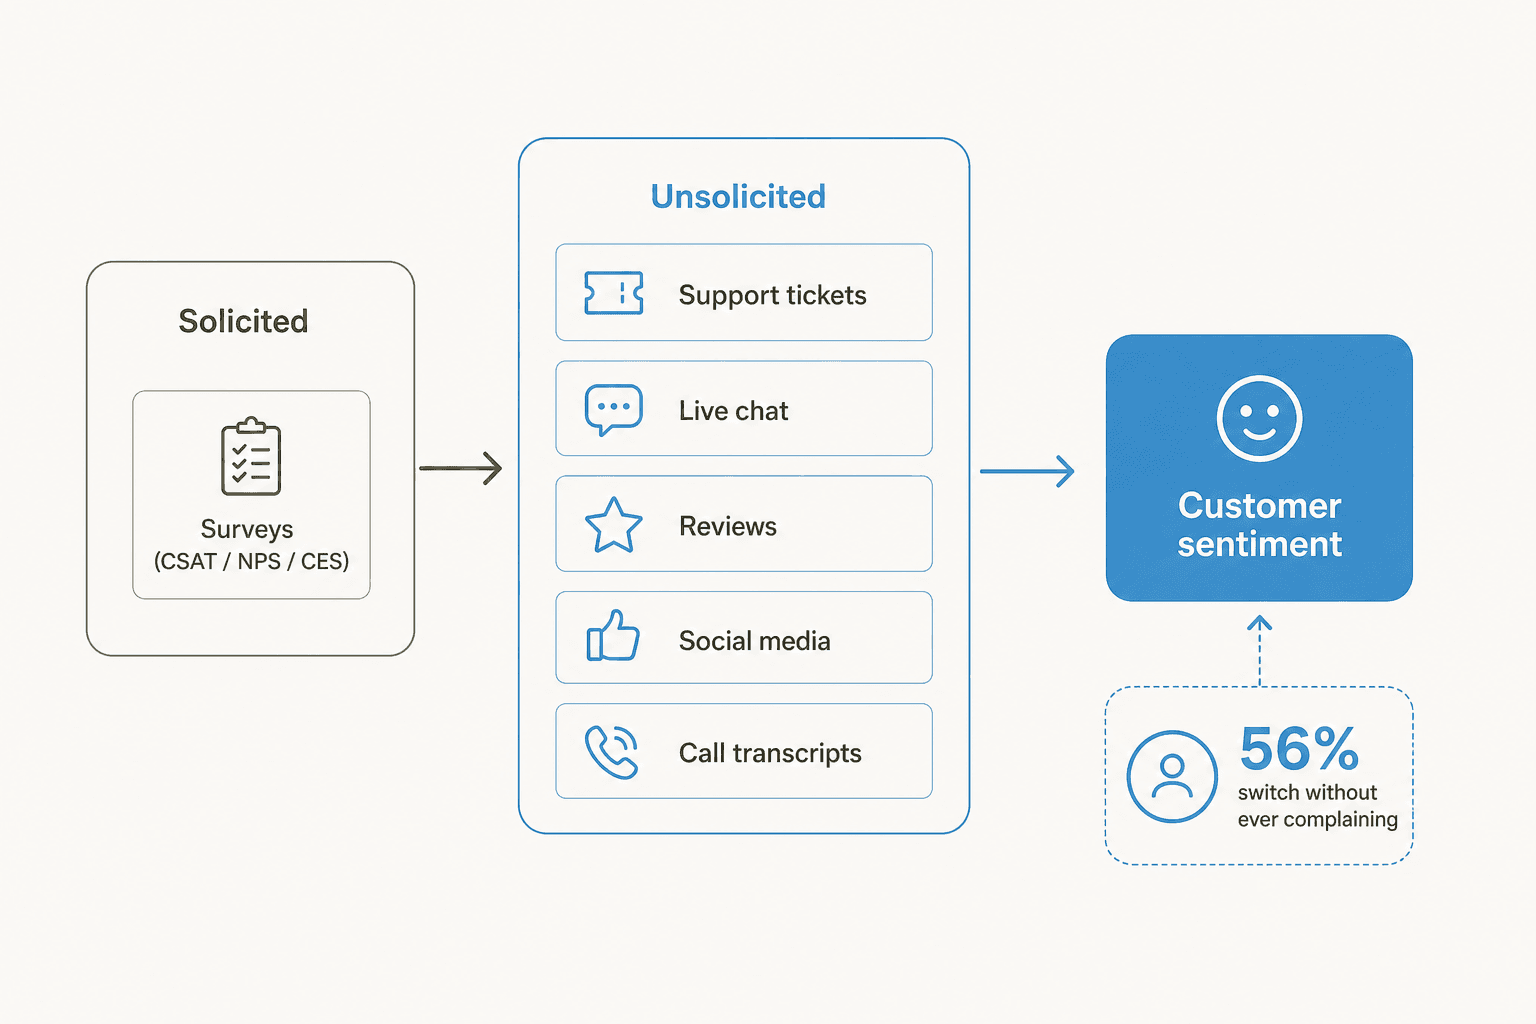
And the people who answer are a self-selecting slice. The angriest churners usually don't fill in your CSAT survey. They just leave. Zendesk's benchmark data puts a number on it: 56% of consumers rarely complain about a negative experience and quietly switch to a competitor instead, while 73% will switch after multiple bad experiences and more than half after only one. PwC's research says roughly the same thing from the other side: 32% of consumers will walk away from a brand they love after a single bad experience.
So if your survey response rate is 15% (a normal number), the survey is telling you how the loudest, most engaged 15% feels. The silent majority, the ones who are about to cancel, are invisible. That's why Gartner projected that 60% of service organizations would adopt analytics to supplement traditional surveys by analyzing voice and text interactions, because surveys "often fail to gather the full range of customer opinions... leading to a knowledge gap."
The fix isn't a better survey. It's reading the feedback customers are already leaving you, unprompted, in every ticket.
Reading sentiment straight from the conversation
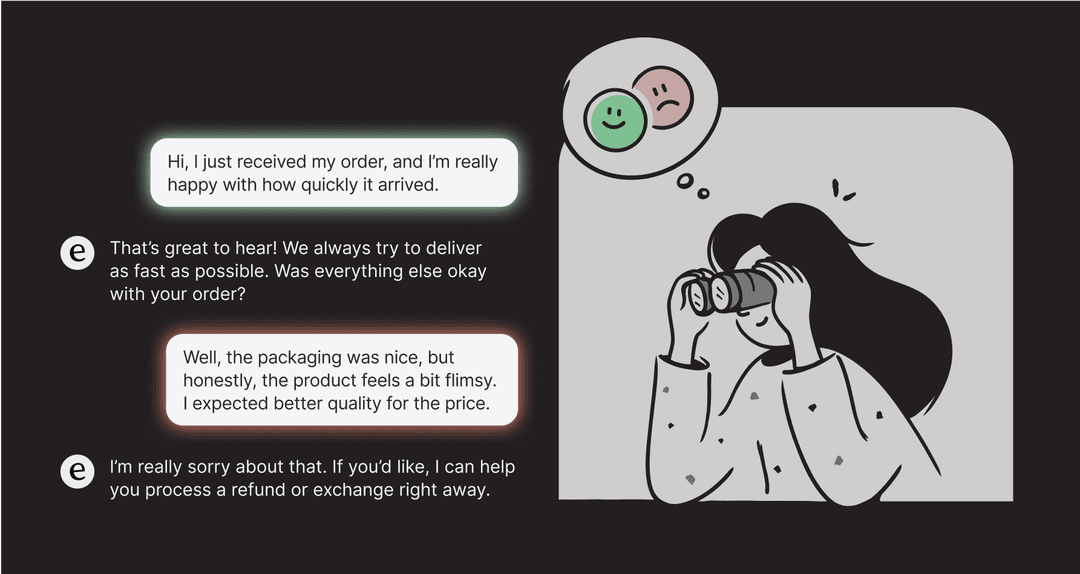
This is the layer that separates teams who think they measure sentiment from teams who actually do. Instead of asking customers how they feel, you read how they feel from what they already wrote.
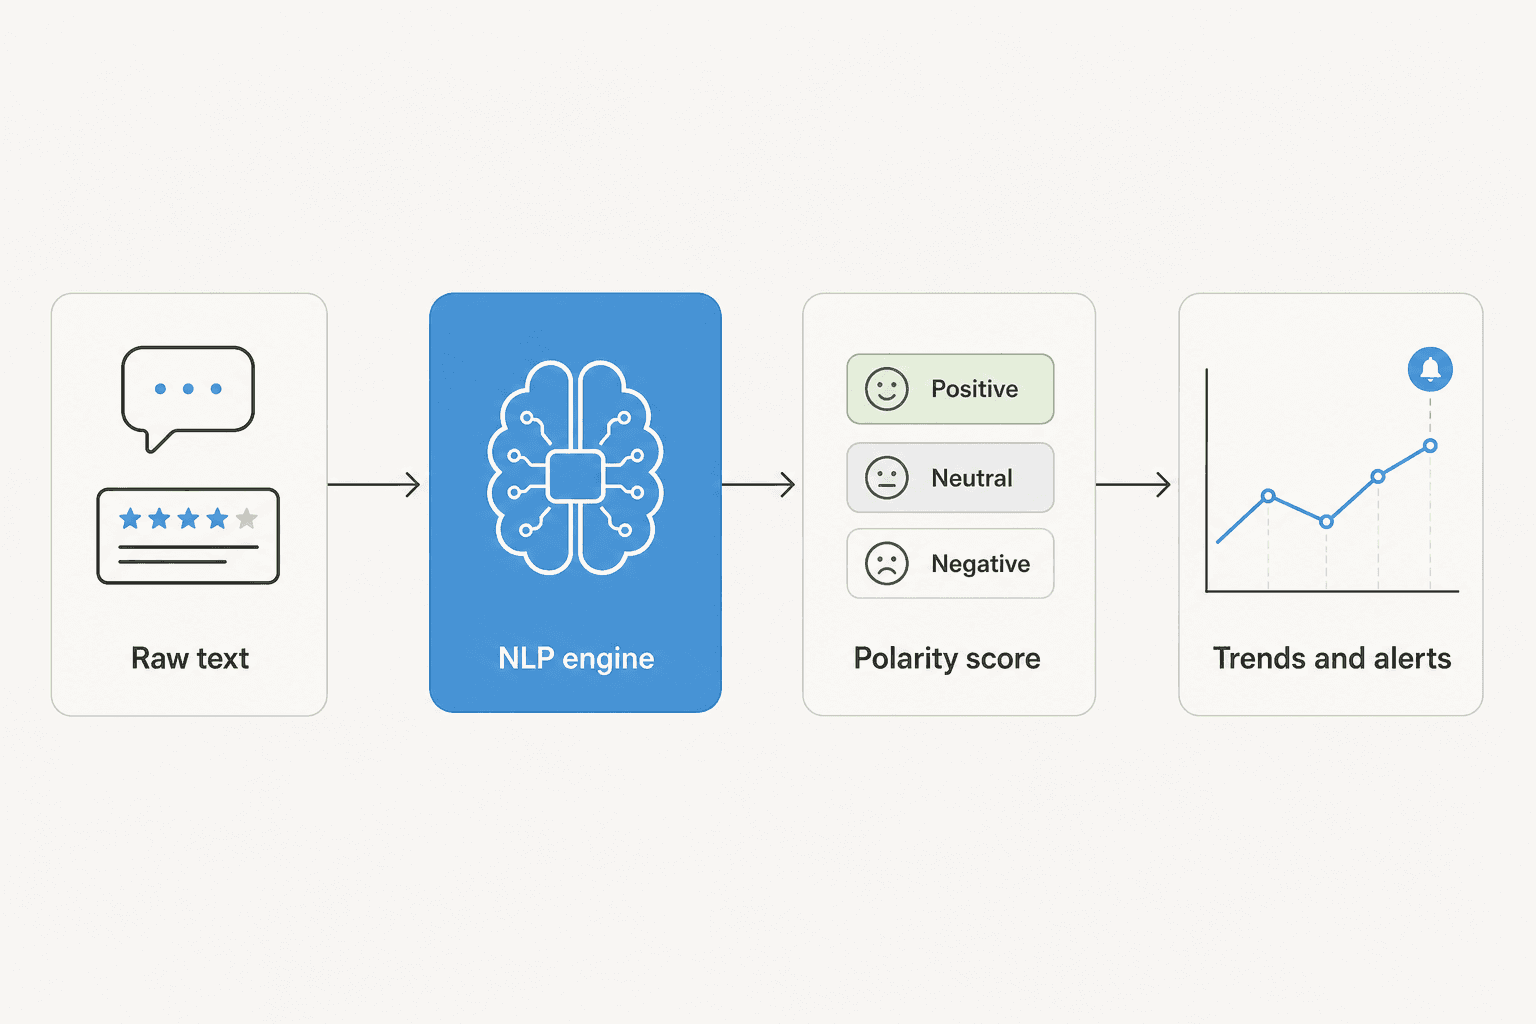
Under the hood, AI sentiment analysis runs your text through one of a few engine types. IBM breaks them into rule-based, machine learning, or hybrid: rule-based tallies words against positive and negative lexicons (fast but brittle), while machine-learning models learn from word choice and word order, which is what lets them handle a real, messy customer message. The output is a polarity score, "expressed by the software as a numerical rating on a scale of one to 100," where zero is neutral and 100 is the most extreme sentiment.
The richer versions go further than pos/neg/neutral. Aspect-based sentiment can tell you the customer loved your product but hated the checkout, scoring each feature separately. Emotion detection picks up frustration or shock rather than just polarity. That granularity is what turns a vague "sentiment is down" into "sentiment on billing tickets dropped after the plan change," which is something you can actually act on.
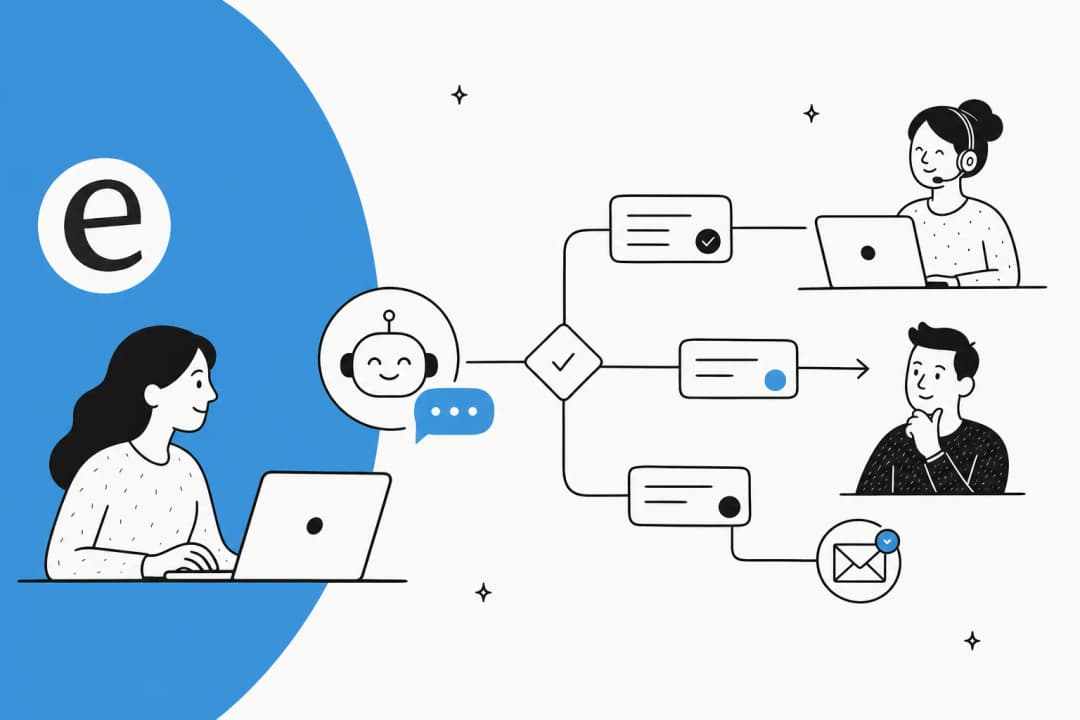
The best part for a support team is that the data source is your existing queue. Every helpdesk now bakes some version of this in, from Zendesk and Freshdesk to Zoho Desk's Zia and Atlassian Intelligence. It doesn't stop at text, either: the same approach applies to call analytics on voice transcripts and to your chatbot analytics. And if you want it to drive action, you can pair sentiment with automatic ticket tagging so an angry ticket routes to a senior agent instantly instead of sitting in a queue.
Where sentiment analysis breaks (and how not to get fooled)
I'd be doing you a disservice if I made this sound like a solved problem. Automated sentiment scoring gets fooled in very specific, very human ways, and if you trust it blindly you'll make bad calls.
IBM is refreshingly honest that "software has a hard time correctly identifying irony and sarcasm." Their worked example says it all:
"Awesome, another thousand-dollar parking ticket-just what I need."
A naive tool reads "awesome" and scores that message positive. Any support agent knows it's the opposite. The other classic failure modes IBM lists are negation ("I wouldn't say the shoes were cheap" gets misread), idioms ("break a leg" read as literal injury), and lost context (a one-word answer like "functionality" flips meaning depending on the question asked).
The way I handle this on my own team: treat automated sentiment as a triage signal, not a verdict. Let it flag the tickets that look negative and route them, but keep a human reading the flagged ones before you draw conclusions. Interestingly, IBM points out AI can also be more objective than a rushed human, who "might label [a review] negative before reaching the positive words." So the goal isn't AI-versus-human, it's AI catching volume the human never had time to read.
A practical way to actually measure it
If I were setting this up from scratch on a support team today, here's the sequence I'd follow:
- Pick one survey metric for your trend line. CSAT after ticket resolution is the easiest to start with. Don't run all three; you'll just burn out your customers. Wire it up properly with something like CSAT reporting so the number lands somewhere you'll actually look.
- Always capture the free-text "why." A number tells you that sentiment moved; the comment tells you why. This is the single highest-value field on any survey.
- Turn on AI sentiment scoring across your whole queue. This is the layer that catches the silent 56%. Every incoming ticket gets a polarity score, so you're measuring 100% of contacts, not the 15% who answered a survey.
- Route by sentiment, don't just report on it. A negative-sentiment ticket should escalate automatically. Measuring the mood is pointless if a furious customer still waits in the same queue as a routine password reset.
- Watch the trend, investigate the spikes. Pull it all into one view, like an analytics dashboard for support performance, and treat any sudden dip as a prompt to go read the actual tickets behind it.
Do those five and you're measuring sentiment better than most teams three times your size, because you're reading everyone, not just the survey-responders. It also feeds directly into the broader customer service KPIs you're already tracking, and into the day-to-day problem-solving your agents do. If you're still choosing an AI layer to do the reading, our roundup of the best customer service AI is a good place to compare.
Common mistakes to avoid
A few traps I see over and over:
- Relying only on surveys. Covered above, but it's the big one. The survey population self-selects out your angriest customers, so the score always looks rosier than reality.
- Treating the score as the finish line. Bain calls the raw NPS a "customer balance sheet," useless without the open-text "why". A number you can't explain is a number you can't fix.
- Trusting automated sentiment on sarcasm. Keep a human in the loop on flagged tickets until you trust the model on your own data.
- Using a single metric for everything. Qualtrics notes CES "doesn't always give the full picture and should be used in tandem with NPS." Match the metric to the question.
- Measuring but never acting. The whole point of reading sentiment is to change something, whether that's reducing ticket volume with AI on the topics that make people angry, or fixing the high-effort moments CES exposes.
Measure sentiment on every ticket with eesel
Here's the honest gap in most sentiment setups: reading a survey is easy, but reading every conversation is where teams give up, because no human has time. That's exactly the job eesel does.
eesel is an AI teammate that plugs into your existing helpdesk (Zendesk, Freshdesk, Gorgias, Help Scout, and more) and reads every ticket as it lands, tagging sentiment, triaging by urgency, and rolling it all into reports you can actually act on. Because it works on your real queue, you're measuring sentiment across 100% of contacts, not the fraction who answer a survey. And since it prices per ticket it handles rather than per seat, the sentiment tagging comes along with the resolution work instead of as another line item.
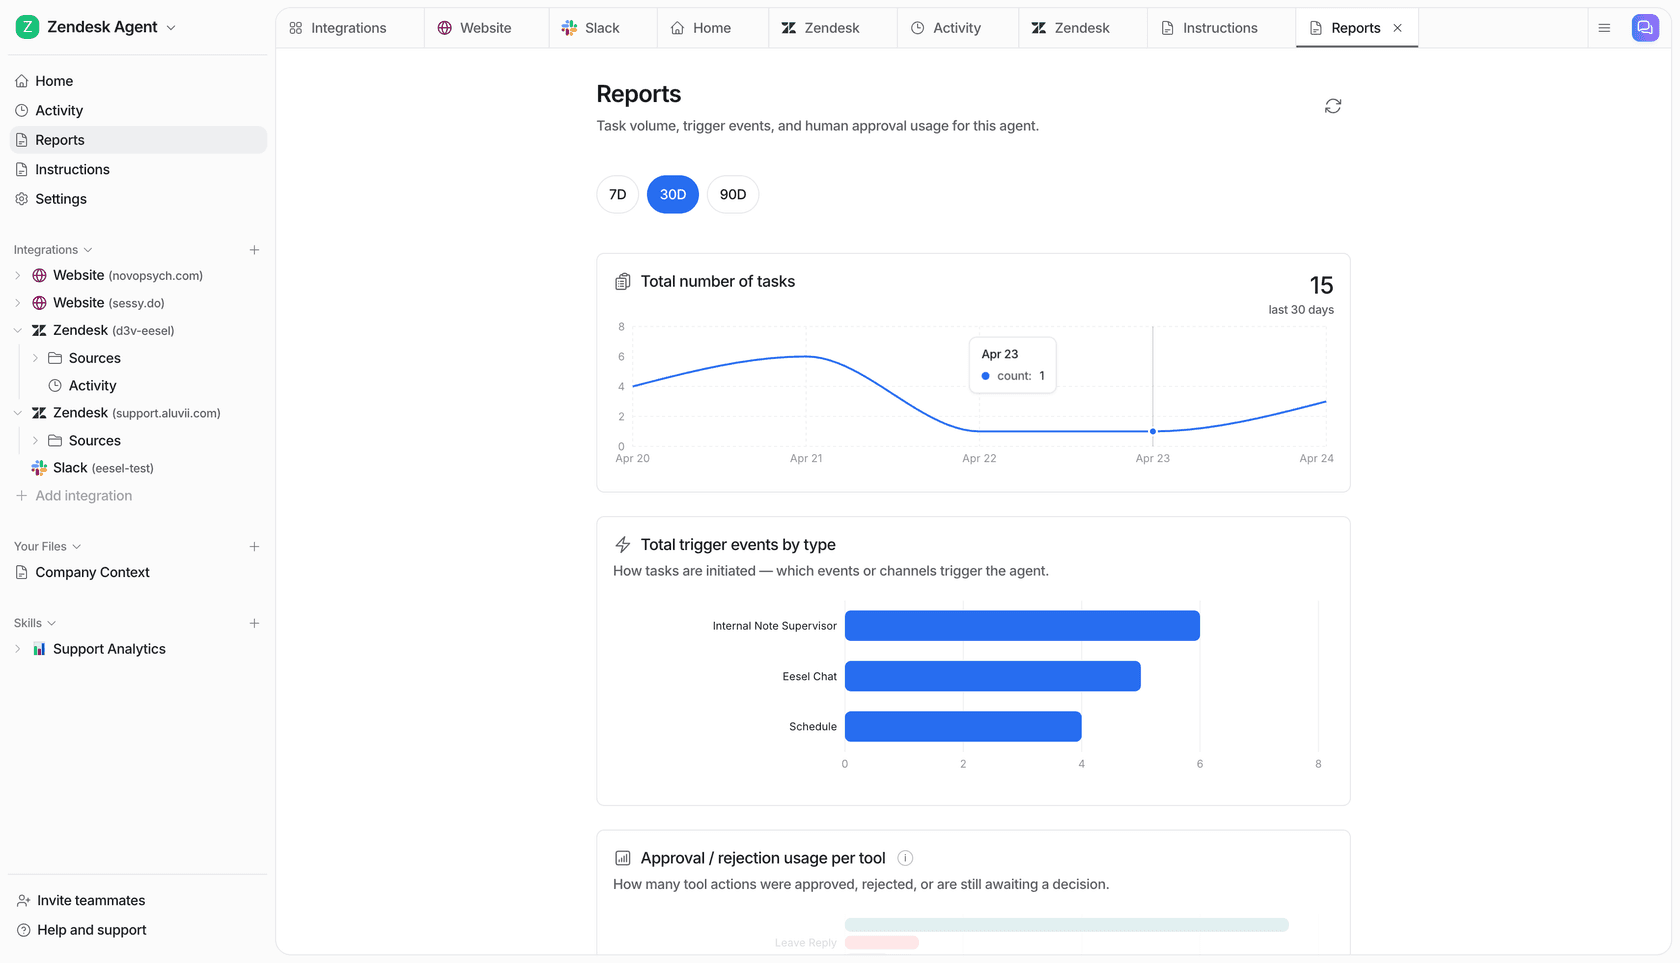
One thing I'd genuinely flag from running these rollouts: eesel lets you simulate against your historical tickets before it touches a live customer, so you can see how it scores and routes real past conversations first. You can try eesel free and point it at your own queue to see the sentiment layer working on day one.
Frequently Asked Questions
What is the best way to measure customer sentiment?
What is the difference between customer sentiment and customer satisfaction?
How is customer sentiment measured with AI?
What metrics measure customer sentiment?
How much does customer sentiment analysis cost?
Why do customer sentiment surveys give misleading results?


Article by
Riellvriany Indriawan
Riell is a designer and writer at eesel AI with about two years of experience researching CX platforms, AI chatbots, and helpdesk software. She combines her design background with a sharp eye for how these tools actually look and feel in practice — making her comparisons unusually visual and user-focused.